
In the context of auditing, this method offers two key applications:
- Grouping transactions based on characteristics
- Identifying outliers that may indicate errors or fraud
This article focuses mainly on the second objective: identifying outliers in general ledger transactions. But first, we provide an overview of general applications.
What is K-means clustering?
K-means is an unsupervised machine learning algorithm that divides data into k groups (clusters) based on their mutual distance. The goal is to maximize similarity within a cluster and maximize differences between clusters.
Why is it relevant for auditing?
For auditors, analyzing thousands or even millions of transactions can be overwhelming. K-means clustering provides support by adding structure to complex datasets. By grouping transactions based on similar features, auditors can more quickly gain insights into typical patterns and behaviors within financial processes. When certain transactions deviate significantly from these patterns — for instance, in terms of amount, time, or combination of attributes — they can be flagged as outliers. This helps focus attention on potentially risky or erroneous entries.
Clustering not only aids in fraud detection but also supports risk-based planning, sampling, and process understanding. It contributes to a more efficient and effective audit approach.
Example: analyzing general ledger transactions
Suppose you have a dataset of general ledger transactions and want to check for unusual entries. We apply K-means to group transactions, then identify outliers: the entries that least fit into a cluster.
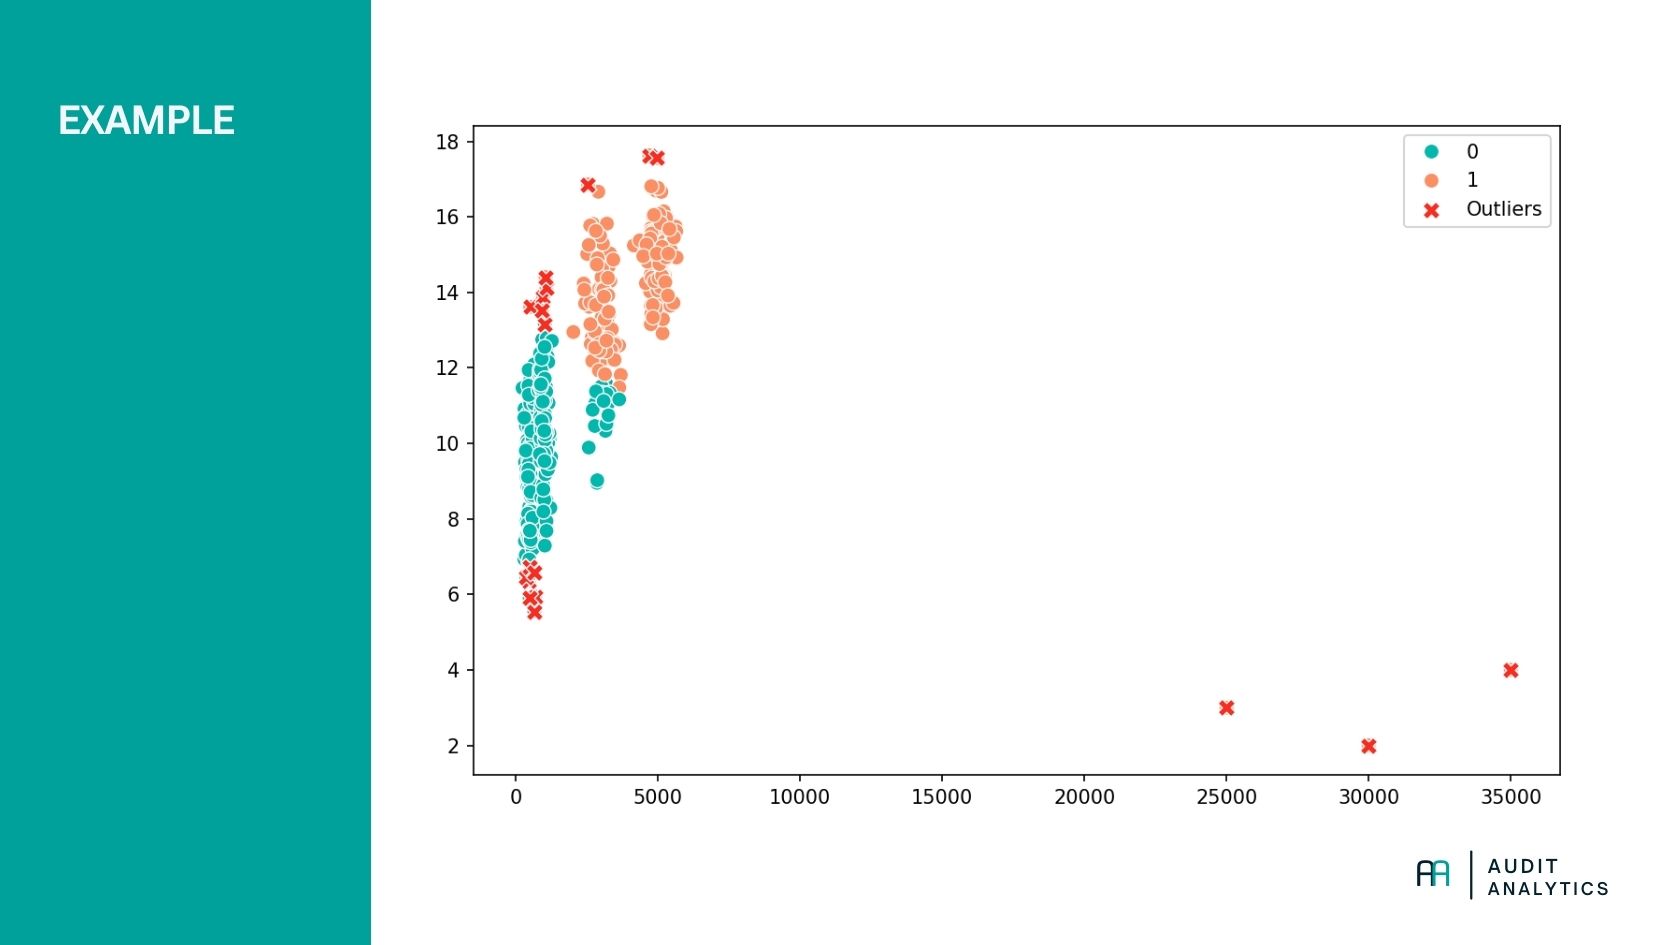
In the example above, the dummy dataset includes some high-value entries at unusual times. The algorithm is configured to form two clusters. Any transactions that do not fit well into a cluster (the 5% with the greatest distance from a cluster center) are defined as outliers.
Choosing the number of clusters
Before applying K-means, it's important to determine the correct number of clusters (k). This defines how many groups the algorithm will form. In the above example, we expected two clusters. However, if we expected four, the result would be:
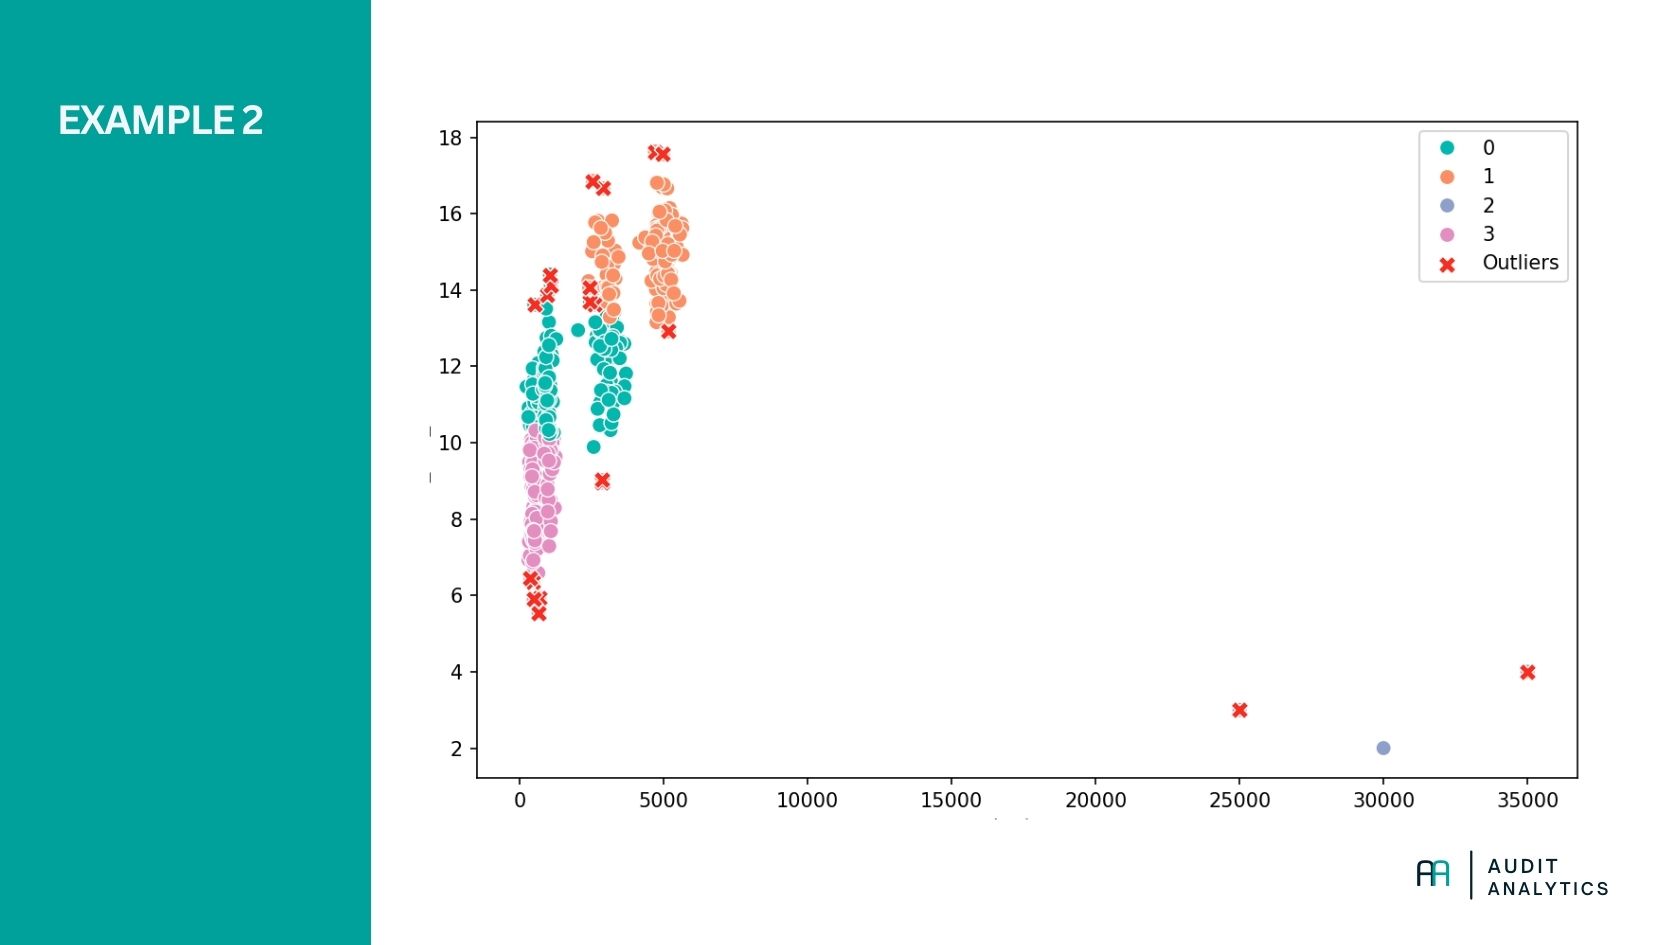
As you can see, a different set of outliers is now identified. This makes sense, since there are now more cluster centers. It's therefore crucial to choose a suitable number of clusters and be able to justify your choice.
A commonly used method is the elbow method, where you plot the variance within clusters against the number of clusters. The point where the decrease in variance flattens (the "elbow") often indicates a good choice.
Normalization
For effective clustering, it's important that all variables are on a comparable scale. For instance, if you use both transaction amounts (in thousands of euros) and time of day (in hours), without normalization the algorithm will focus more on the amounts due to the larger scale. By normalizing (standardizing) the data, all variables are brought to the same scale, typically with mean 0 and standard deviation 1. This prevents one variable from unintentionally dominating the clustering.
Step-by-step Python script
We use Python with pandas, scikit-learn, and matplotlib. If you haven't installed these packages yet, do so using pip:
pip install pandas scikit-learn matplotlib
This script also includes simulated sample data.
import pandas as pd
import numpy as np
from sklearn.preprocessing import StandardScaler
from sklearn.cluster import KMeans
import matplotlib.pyplot as plt
import seaborn as sns

# Sample data: simulated general ledger transactions
np.random.seed(42)
data = pd.DataFrame({
    'amount': np.concatenate([
        np.random.normal(500, 100, 100),
        np.random.normal(1000, 100, 100),
        np.random.normal(3000, 300, 100),
        np.random.normal(5000, 300, 100),
        [25000, 30000, 35000]  # outliers
    ]),
    'hour_of_day': np.concatenate([
        np.random.normal(9, 1.5, 100),
        np.random.normal(11, 1.5, 100),
        np.random.normal(13, 1.5, 100),
        np.random.normal(15, 1.0, 100),
        [3, 2, 4]  # outliers
    ])
})

# Normalize the data
scaler = StandardScaler()
data_scaled = scaler.fit_transform(data)

# K-means clustering with 2 clusters (example).
kmeans = KMeans(n_clusters=2, random_state=60)
data['cluster'] = kmeans.fit_predict(data_scaled)

# Calculate distance to cluster center
data['distance_to_center'] = np.linalg.norm(data_scaled - kmeans.cluster_centers_[data['cluster']], axis=1)

# Outliers: top 5% based on distance
threshold = data['distance_to_center'].quantile(0.95)
outliers = data[data['distance_to_center'] > threshold]

# Plot
plt.figure(figsize=(10, 6))
sns.scatterplot(data=data, x='amount', y='hour_of_day', hue='cluster', palette='Set2', s=60)
sns.scatterplot(data=outliers, x='amount', y='hour_of_day', color='red', label='Outliers', s=80, marker='X')
plt.title('K-means clustering of general ledger transactions')
plt.legend()
plt.show()
Interpretation:
- The colors represent clusters. Similar transactions are grouped together.
- The red Xs indicate transactions far from their cluster centers — potential outliers.
- These outliers could be subject to further audit inspection.
When is K-means less suitable?
While K-means is a useful technique, there are situations where it performs poorly. K-means assumes clusters are roughly equal in size and that all variables contribute equally to distance calculations. If real clusters vary greatly in size or shape, or if there's significant noise in the data, K-means may group data incorrectly. It's also less suitable for categorical variables or non-linear structures. So prepare your dataset carefully if you plan to use it.
Hopefully, this article has given you a solid introduction to how K-means can be used in auditing. While we focused on outliers, you might also explore customer segmentation or other groupings based on data.