

With today’s enormous volumes of data, it’s simply impossible to manually review every single document. Data analytics helps you spot patterns, trends, and anomalies without having to inspect each record individually.
In this article, we discuss how data analytics can be applied at various stages of the audit, which tools and skills you need, and how to structure a data-analytic audit.
Audit Phases and the Use of Data Analytics
You can apply data analytics in virtually every phase of the audit. Below we outline each phase and give examples of relevant analyses.
1. Planning Phase
During the planning phase, you’re primarily focused on setting up procedures and agreements for the audit itself. However, even at this stage you can already assess which applications or datasets might be available and of potential value to the audit.
Example:
- Ask how data can be obtained. Questions to consider include:
- Which applications are in use?
- Are you already familiar with these applications?
- Does the client have sufficient in-house expertise?
- Is an external IT provider involved?
2. Interim Phase
In this phase, you seek to understand the processes, controls, and associated risks. Analytics can help here too. Think process mining to verify flows or evaluate data quality.
Examples:
- Use process mining to compare actual transaction flows against expected internal control procedures.
- Analyze system log files to identify unusual or unauthorized access patterns in financial systems.
- Check whether purchase invoices always include an internal invoice number that can be reliably linked to the financial ledger.
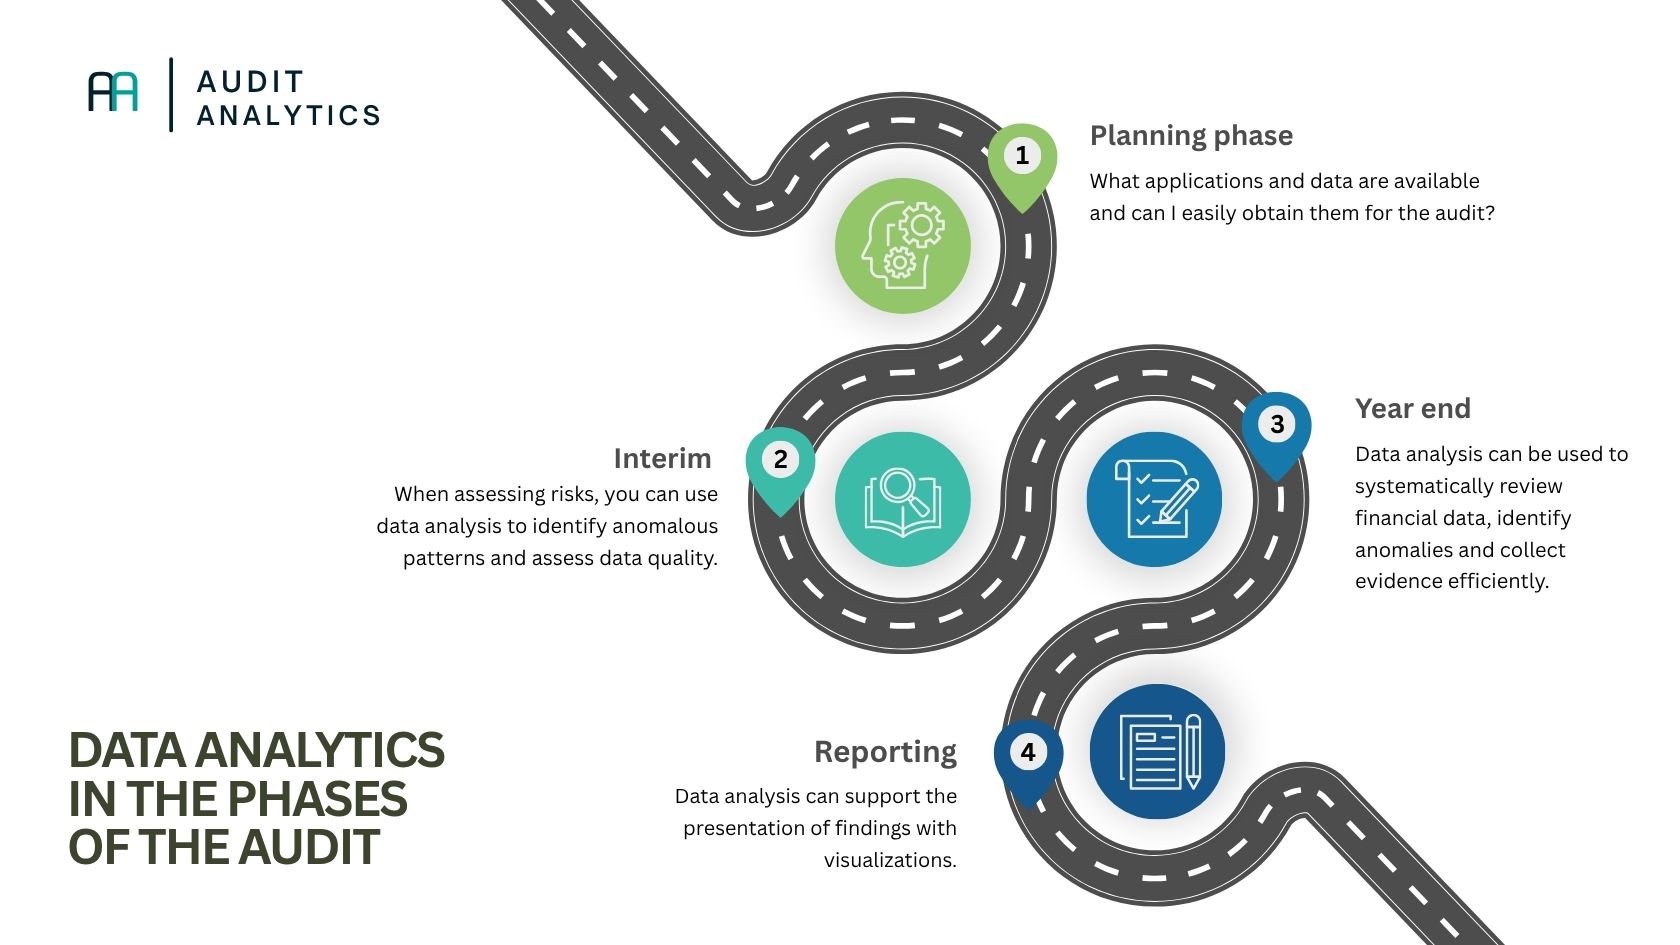
3. Fieldwork Phase
Here you perform the actual audit tests defined in your control strategy. Using data analytics at this stage can help you target your sampling or even test the entire population rather than just a subset.
Examples:
- Reconcile received invoices with purchase orders and goods receipts to identify discrepancies.
- Detect duplicate payments by searching for invoices with identical amounts, vendors, and dates.
4. Wrap-Up and Reporting
As the audit wraps up, you use data analytics to substantiate findings and present them clearly to the client.
Examples:
- Build a dashboard of key audit findings, including charts that show trends and risk areas.
- Use data visualizations to highlight anomalous transactions or unusual patterns for stakeholders.
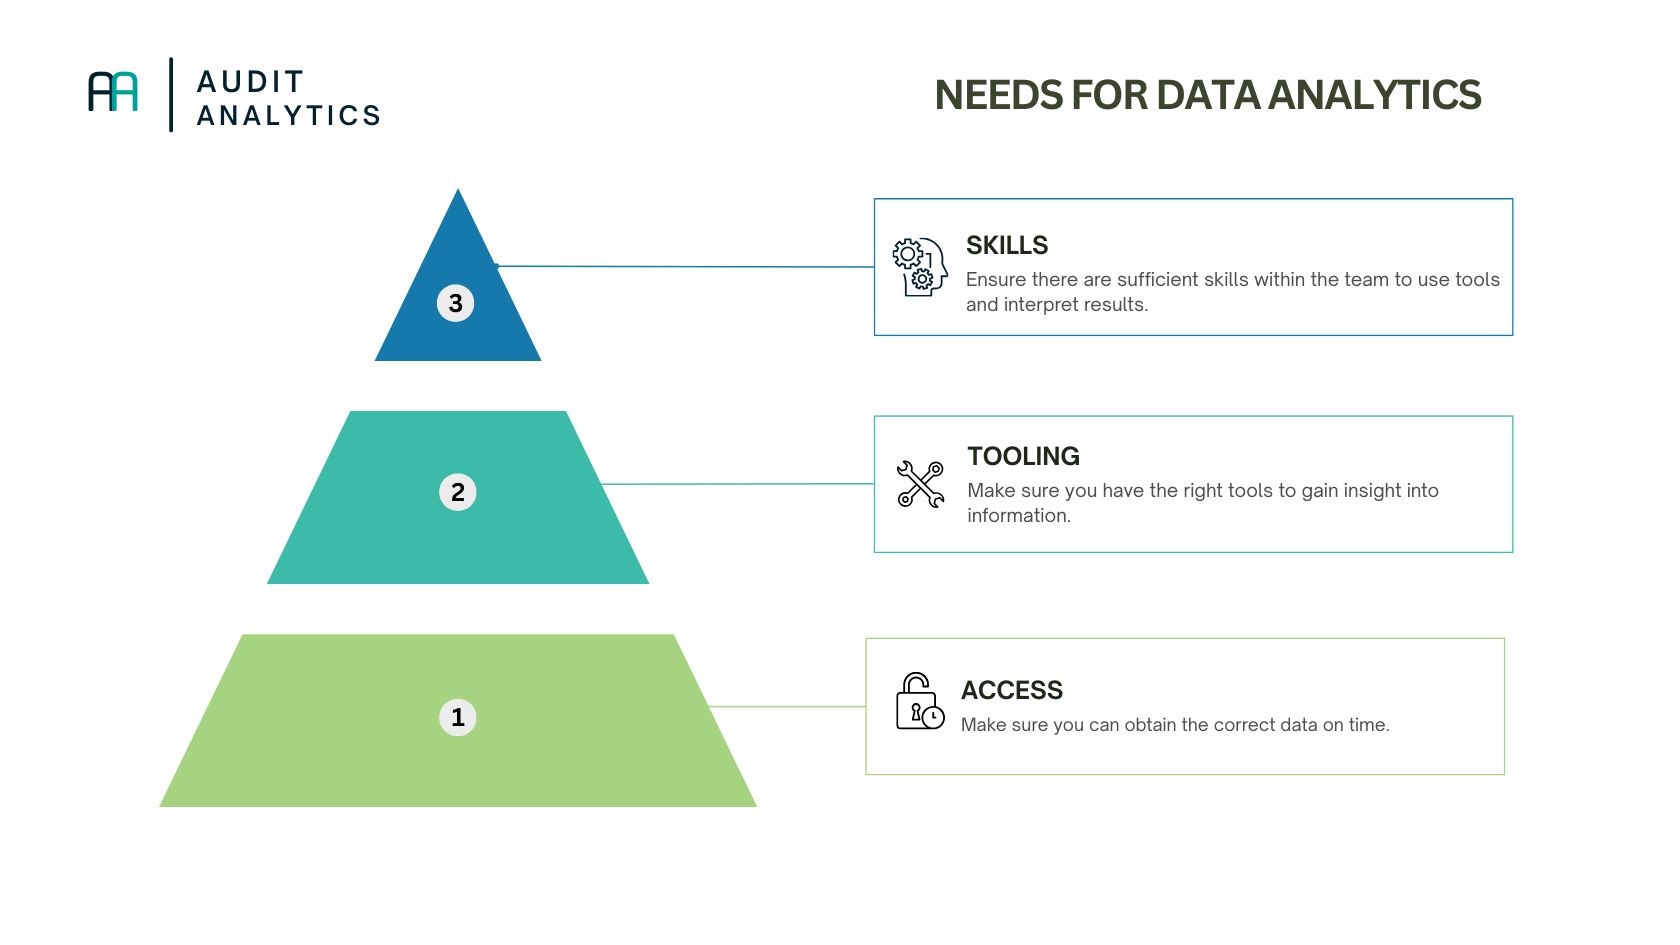
What You Need for Audit Data Analytics
When you decide to use data analytics in your audit, there are a few essentials. It starts with understanding the available data and how it can yield insights. You’ll also need the right tools and techniques, and people who know how to use them.
-
Access to the Right Data
How do you obtain the right data?- Data may come from ERP systems, accounting software, or other operational databases.
- Data must be complete and reliable; otherwise, your analysis may be misleading and of little value.
-
Appropriate Tools
Which tools might you need? Common examples include:- Excel (for basic analyses like pivot tables and lookup functions)
- Power BI, Qlik, or Tableau (for advanced visualizations)
- Python, R, or SQL (for complex analyses and machine-learning applications)
-
Relevant Skills
How do you know if someone can turn data into audit insights?- Knowledge of statistics and data-analysis techniques.
- Experience with the chosen tools.
- The ability to interpret results and translate them into audit findings.
Of course, you don’t need one person who masters all tools and skills. These can be distributed across a team.
How to Conduct a Data-Analytic Audit (Step-by-Step)
Once you have an idea, it’s time to put together a plan. Data analytics can be deployed in different ways depending on your audit objective and available data. The following step-by-step guide can help.
Step 1: Define Your Objective
What do you want to achieve with data analytics? Do you aim to map risks, reduce client workload, or speed up testing? Define this before you start.
Step 2: Collect and Explore the Data
Ensure you have access to the relevant datasets. Then explore the data to understand which fields are available and whether there are any obvious issues (e.g., missing values or extreme outliers).
Step 3: Clean and Prepare
Data can be messy and error-prone. Before analysis, you should:
- Remove duplicate records.
- Fill in or exclude incomplete records.
- Standardize date and number formats.
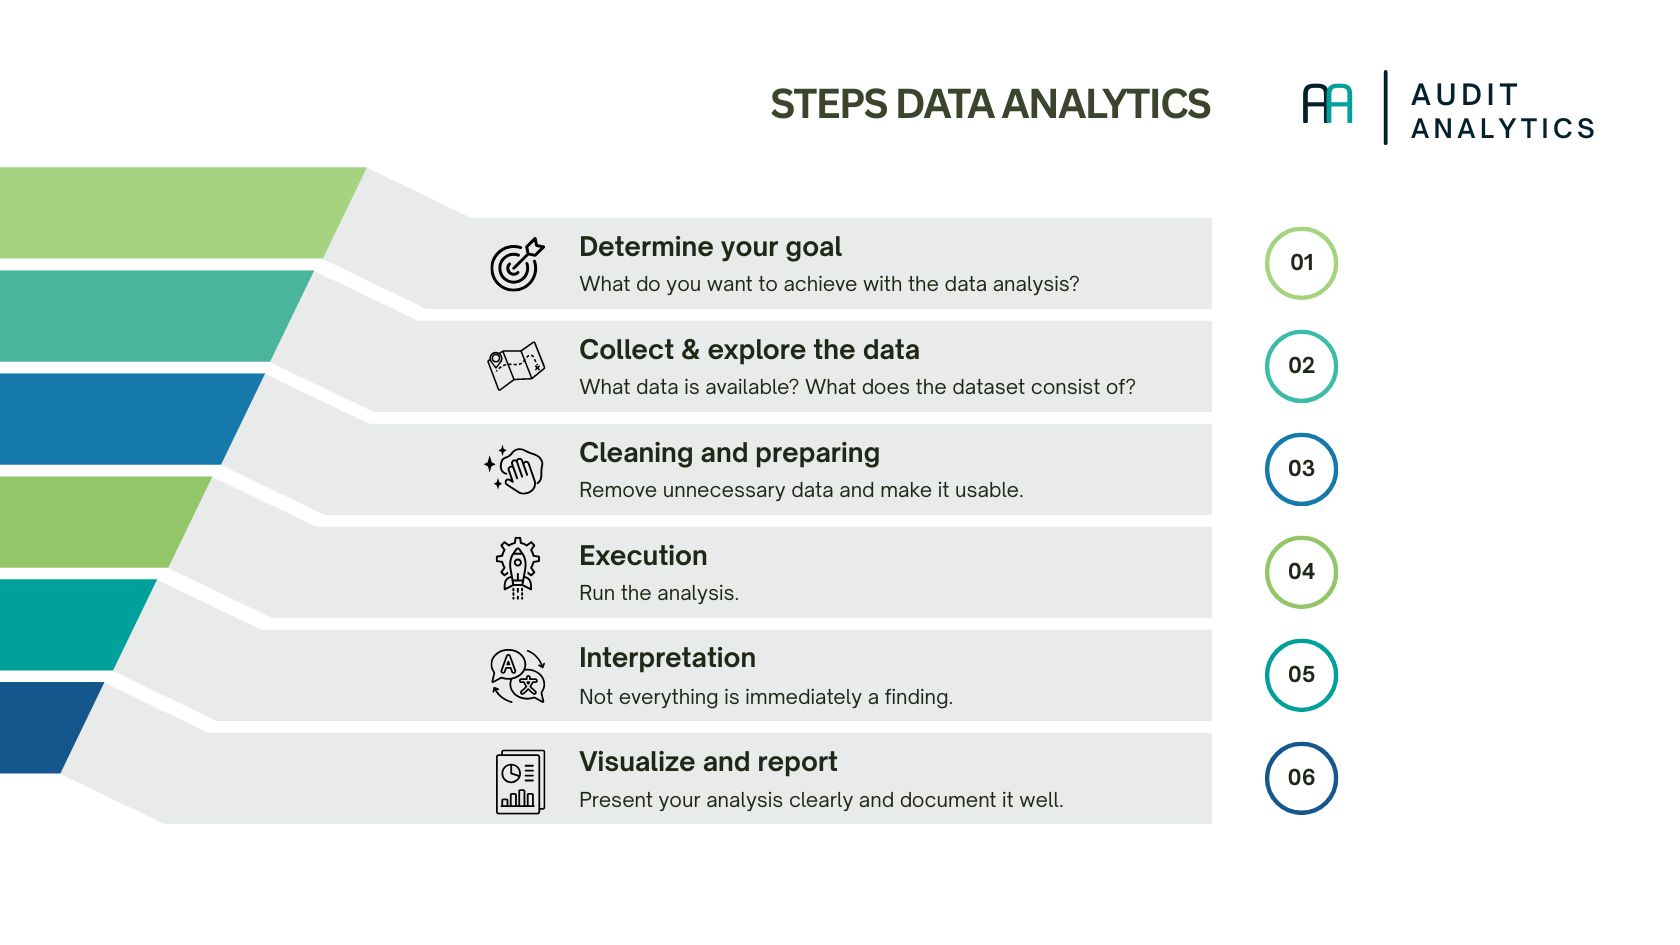
Step 4: Perform Analyses
Choose the right technique for your objective. Examples include:
- Descriptive Analysis: Basic statistics like means, variances, and counts.
- Trend Analysis: Comparisons across periods.
- Anomaly Detection: Identifying transactions that deviate from the norm.
Step 5: Interpret Results
Not every deviation is an issue. Think critically about what the data tells you and combine it with other audit information. Often, there’s a logical explanation.
Step 6: Visualize and Report
Use charts, tables, and dashboards to present your findings clearly. This makes it easier for your audit team and the client to understand and act on the results. Based on your analysis, provide concrete recommendations; from improving internal controls to conducting further investigations.
Conclusion
After reading this article, you should see that audit data analytics isn’t as daunting as it may seem, when you start early, know your goals, and have the right data at hand. And if you need more inspiration, our knowledge base offers many examples across different areas.

