

Benford's Law (also called the First-Digit Law) states that in many natural datasets numbers starting with a low first digit (for example 1 or 2) occur far more often than numbers starting with 8 or 9. That sounds odd, because we tend to think the first digits should be evenly distributed. In reality they are not: a number that starts with 1 has about a 30% chance of appearing, while only about 4 to 5% of values start with 9.
For an auditor that is an interesting conclusion, because deviations from this pattern can sometimes point to artificial manipulation, rounded or invented amounts, illogical pricing, or administrative interventions. Benford's Law is therefore not used as audit evidence, but as a screening tool that helps decide where additional audit effort could be worthwhile.
The theory in brief
Under Benford's Law each first digit follows a known probability distribution. The distribution of the first digits looks like this:
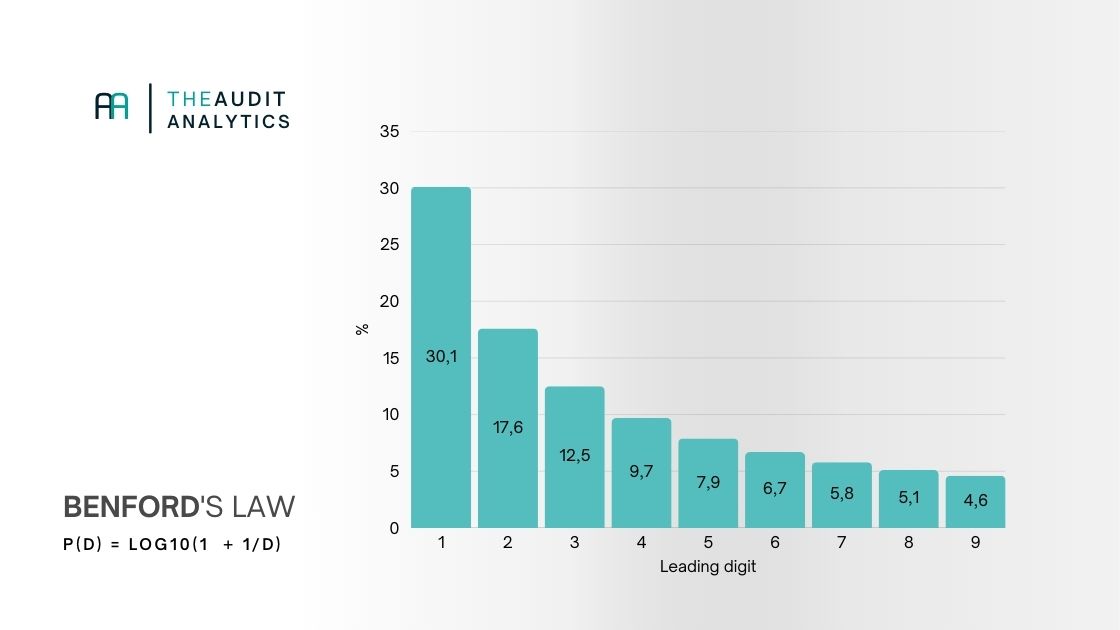
These percentages are determined logarithmically: the chance that a number starts with digit d is log10(1 + 1/d). The pattern was substantiated by Theodore P. Hill in his paper "A Statistical Derivation of the Significant-Digit Law" (1995), where he shows that Benford distributions arise spontaneously when data from different sources and magnitudes are combined.
Which data?
You cannot just use any dataset for Benford's Law. The method works best when you have a large number of transactions (think hundreds to thousands of invoices, expense claims, or journal entries) so there are enough data points to see a statistical pattern. The data should also be broadly spread: amounts ranging from roughly €12 to €18,000 or even higher. Such natural, unconstrained variation makes the logarithmic Benford distribution visible.

By contrast, datasets that are artificially bounded are unsuitable, for example salaries (€4,950 every month), expense claims that are automatically rejected above a limit, or transactions that always stay just below a threshold. Administrative numbering such as invoice numbers, customer numbers, or IDs is also unsuitable, because these are not generated by economic processes but simply increase according to a system. In other words: Benford only works when the figures result from natural financial transactions and are not forced by rules, processes, or numbering.
When is Benford's Law useful in the audit?
In audit practice Benford is mainly used for financial transaction amounts. Think sales invoices, purchases, expense claims, or general ledger entries. In such datasets amounts are rarely completely random, but they do follow natural economic patterns.
When people fabricate invoices, prefer rounded amounts, or selectively choose certain values, it is surprisingly difficult to intuitively mimic a Benford-like distribution. Precisely for that reason Benford can show deviations that provide a starting point for further investigation.
On the other hand, Benford is not suitable for data such as salaries (often fixed monthly amounts), percentages, counts of days, VAT rates, or administrative codes. These values simply do not follow an economic or natural distribution and therefore should not be assessed with Benford.
Practical example in Python
Time to apply it! Below we work with (fictitious) employee expense claims. The company has filed hundreds to thousands of claims over a year, ranging from small expenses (coffee, parking, taxis) to larger items such as hotel stays and airfare. This dataset is ideal for Benford's Law: many transactions, natural variation in amounts, and no artificial boundaries.
With the steps below you perform a first-digit analysis to assess whether the expense pattern follows a natural distribution or whether there are signs of rounding, manipulation, or other unusual patterns that merit further review.
Load data and extract first significant digits
We start by cleaning the expense amounts and determining the first significant digit. This is the first digit that really matters; so no leading zeros, currency symbols, or thousand separators.
import re
import pandas as pd
import numpy as np
import matplotlib.pyplot as plt

df = pd.read_csv("your_dataset.csv")

# Ensure the amount is numeric
df["Amount"] = pd.to_numeric(df["Amount"], errors="coerce")
df = df.dropna(subset=["Amount"])
df = df[df["Amount"] != 0]

# Determine the first significant digit (strip currency, thousand separators, and leading zeros)
def first_sig_digit(x):
    cleaned = re.sub(r"[^\d]", "", f"{abs(x):f}")
    cleaned = cleaned.lstrip("0")
    return int(cleaned[0]) if cleaned else np.nan

df["FirstDigit"] = df["Amount"].apply(first_sig_digit)
df = df.dropna(subset=["FirstDigit"])
df["FirstDigit"] = df["FirstDigit"].astype(int)
Compare actual and expected distribution
Next we calculate how often each first digit actually occurs in the claims and compare that with the Benford expectation.
actual = df["FirstDigit"].value_counts(normalize=True).sort_index() * 100

benford = pd.Series(
    [30.1, 17.6, 12.5, 9.7, 7.9, 6.7, 5.8, 5.1, 4.6],
    index=range(1, 10)
)
Visualization
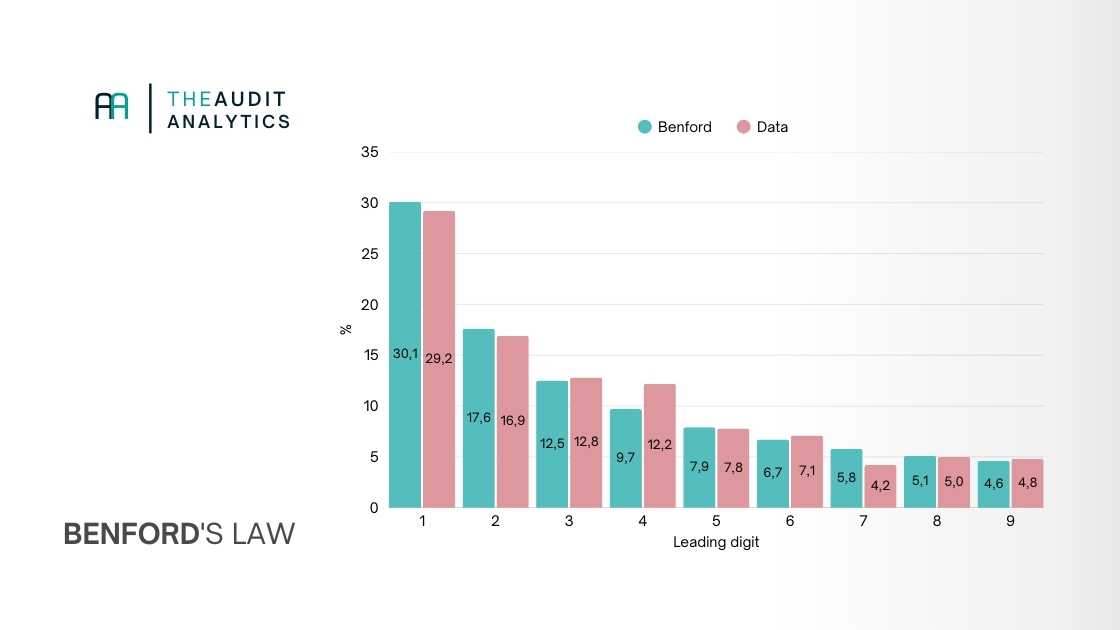
The chart below shows at a glance whether the expense pattern matches Benford's Law. Large differences can indicate rounding behavior, deliberately chosen amounts, or structural deviations.
plt.figure(figsize=(10, 6))
plt.bar(benford.index - 0.15, benford.values, width=0.3, label="Benford (expected)")
plt.bar(actual.index + 0.15, actual.values, width=0.3, label="Dataset (actual)")

plt.title("Benford's Law - comparing actual distribution to expectation")
plt.xlabel("First digit")
plt.ylabel("Percentage")
plt.grid(axis="y", linestyle="--", alpha=0.6)
plt.legend()
plt.tight_layout()
plt.show()
It might look like this:
Testing: is there really a deviation?
A visual comparison between the dataset and Benford's Law provides a first impression but is not enough to determine whether a deviation is truly meaningful. Small differences can look large in a chart, and subtle patterns may not stand out. That is why you use a formal test to quantify the deviation and determine whether the pattern falls within normal variation.
Mean Absolute Deviation (MAD)
MAD is the most commonly used metric in forensic Benford analyses. The test calculates the average absolute deviation between the actual distribution and the Benford expectation.
Reference thresholds according to Nigrini:
< 0.006 = consistent with Benford
0.006-0.012 = possibly non-Benford
0.012 = clearly non-Benford
MAD is robust and especially simple to calculate. That makes it accessible and well-suited for audit use. It gives you an indication; that is precisely the intent when using Benford's Law in the audit.
Other tests
If you want more statistical certainty you can also use tests such as chi-square or the Kolmogorov-Smirnov test. These measure the total deviation of the distribution but can become "significant" quickly when you have many observations.
Example
Below is an example of how to calculate the MAD test with Python.
import numpy as np
import pandas as pd

# Benford expected distribution
benford = pd.Series(
    [30.1, 17.6, 12.5, 9.7, 7.9, 6.7, 5.8, 5.1, 4.6],
    index=range(1, 10)
) / 100

# Actual distribution from earlier steps (as percentages)
actual = actual / 100  # convert to fractions

# MAD calculation
mad = (actual - benford).abs().mean()

mad
Suppose the MAD test on the employee claims yields a score of 0.0148. That is above the 0.012 threshold and therefore falls into the "non-Benford" category.
This does not prove whether there is fraud (fraudsters who know the law can anticipate it), but it does indicate where you may want to pay extra attention.

